The first quarter of 2017 is now behind us, and although we won’t have complete economic data for a while, we do know that domestic stocks had a solid start to the year. Last week, major indexes took a pause from some recent gains and began the second quarter of 2017 with less than thrilling performance. The S&P 500 lost 0.30%, the Dow was down 0.03%, the NASDAQ gave back 0.57%, and the MSCI EAFE declined 0.72%. For this week’s update, we’re going to examine what happened to markets in the first quarter.
How did markets perform in Q1?
All three major domestic indexes posted sizable gains in the first three months of 2017:
- S&P 500 up 5.5%
- Dow up 4.6%
- NASDAQ up 9.8%
The NASDAQ’s nearly double-digit growth represented its best quarter since 2013.
However, the majority of the markets’ gains happened in January and February. While the NASDAQ increased 1.48% in March, the S&P 500 stayed flat, and the Dow lost 0.72% in the same period.
Which stocks outperformed in Q1?
Large cap stocks – companies with more than $5 billion in market capitalization – drove much of the growth we saw last quarter. Tech stocks performed especially well, gaining more than 12% over the quarter. In fact, S&P Info Tech, which tracks information technology stocks in the S&P 500, was the quarter’s highest performing sector index.
How did politics affect market performance in Q1?
As the new presidential administration came to power last quarter, investors closely followed policy news and headlines. We encourage you to pay more attention to economic fundamentals than media reports, but we understand that completely ignoring political conversations would have been challenging in Q1.
Overall, investor expectations for the new administration’s pro-growth policies helped push the markets to numerous record highs last quarter. However, when Congress chose not to vote on the American Health Care Act, market concerns increased about whether new policy changes would actually occur. The Dow lost 317 points the week of the expected – but cancelled – healthcare vote.
How high was volatility in Q1?
Even though policy debates have seemed to heighten the emotional landscape this year, the VIX measure of volatility recorded its lowest Q1 average ever. The 11.69 level is also the second lowest quarterly average since 1990.
What might be on the horizon?
Earnings season is upon us, and investors will be watching to see whether reports match expectations. According to FactSet, the S&P 500’s estimated earnings growth rate for Q1 2017 is 8.9% – which would be its best year-over-year earnings growth since 2013. Only a handful of S&P 500 companies have reported their earnings so far; of these reports, 57% exceeded the mean sales estimate and 74% exceeded the mean earnings-per-share estimate.
In addition to earnings, the Federal Reserve’s interest-rate decisions will be on many people’s minds throughout 2017. After raising rates on March 15, the Fed expects at least two more increases this year. So far, the markets absorbed these increases well, with the Dow even gaining 100 points on the Fed’s last meeting day.
Ultimately, we have many data points, policy updates, and economic indicators to focus on in the coming months. As of now, 2017 has started with strong market performance, high consumer confidence, and low volatility.
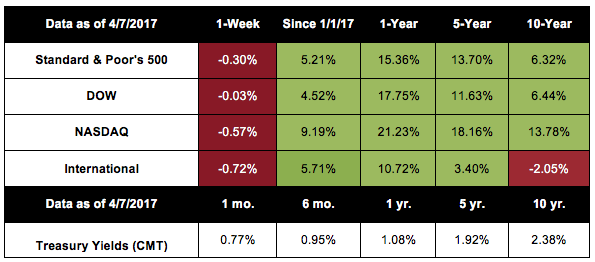
Notes: All index returns exclude reinvested dividends, and the 5-year and 10-year returns are annualized. Sources: Yahoo! Finance, S&P Dow Jones Indices and Treasury.gov. International performance is represented by the MSCI EAFE Index. Past performance is no guarantee of future results. Indices are unmanaged and cannot be invested into directly.